

Space, artificial intelligence, robotics, clean energy, cybersecurity: thematic ETFs let you bet on a disruptive secular trend with a single ticker. However, as any seasoned market participant knows, the hardest part of portfolio construction is not identifying a megatrend, but determining exactly how much capital to risk on its execution.
This guide strips away the marketing hype to analyze what thematic ETFs really represent, what historical asset flows tell us about the actual performance of investors who chase them, and the realistic allocation ranges to safeguard your core capital. We will also look at a concrete case study with real arithmetic, demonstrating how premium expense ratios and underlying volatility can silently erode a portfolio if left unchecked.
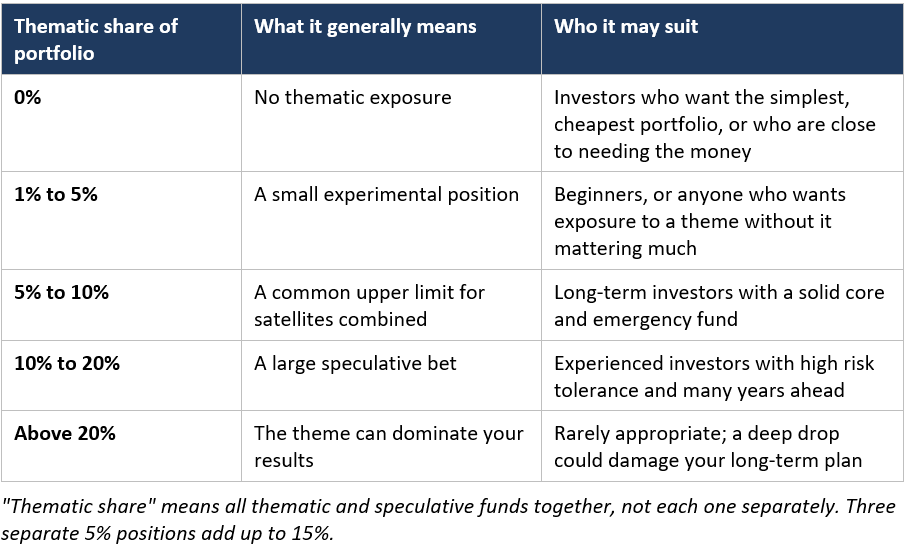
Quick answer: While there is no regulatory limit, consensus among fiduciary advisors suggests capping your combined thematic and speculative exposure at a strict 5% to 10% of your total portfolio, anchoring the remaining 90%+ in broad-market, low-cost index funds. While retail investors with multi-decade time horizons often argue for heavier allocations, historical drawdowns in concentrated sectors prove that pushing beyond a 20% threshold exponentially multi-plies the risk of terminal capital impairment.

What Is a Thematic ETF?
A thematic ETF holds a basket of companies linked to a specific long-term trend rather than tracking the broad market. For example, a space ETF typically consolidates launch companies, satellite operators, defense contractors, and component suppliers, while an AI fund isolates semiconductor manufacturers, software firms, and specialized data centers.
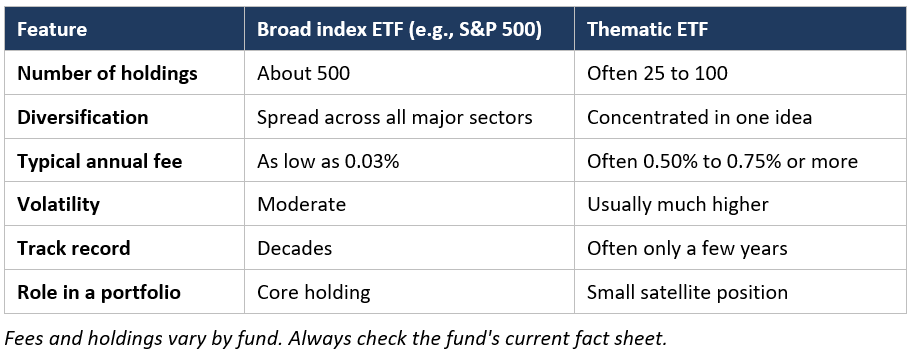
While this laser focus is the primary appeal, it introduces a severe risk of asset concentration. According to the U.S. Securities and Exchange Commission (SEC), these niche products often carry significantly higher internal fees (expense ratios) and volatility than traditional index funds. This structural focus is both its biggest selling point and its greatest risk. Compare a typical broad fund with a typical thematic fund:
What the Evidence Says About Thematic Funds
The investment research firm Morningstar has extensively studied how retail investors actually fare in specialized strategies. In their comprehensive Morningstar “Mind the Gap” Global Report, analysts tracked the structural cost of emotional trading decisions, proving that performance chasing severely degrades real-world returns. Two findings stand out:
- The Performance Gap is Massive: Investors earned far less than the funds did. In a five-year study, thematic funds averaged about 7.3% annually, yet the average investor walked away with roughly 2.4% a year. This massive shortfall stems entirely from buying during peak media hype and panic-selling during inevitable sector corrections.
- The Attrition Rate is High: Many thematic funds simply don’t survive. Data from the Morningstar Global Thematic Funds Landscape reveals that over 50% of these specialized vehicles fail to survive a 15-year period due to structural liquidations.
The lesson isn’t that structural themes never work, as select funds have delivered explosive historical outperformance. The lesson is that systemic investor behavior—namely chasing hype with unhedged, badly timed bets—is a proven wealth destroyer. A smaller, fixed satellite allocation is a necessary defensive boundary to protect your capital from your own trading impulses.
The Core-and-Satellite Approach
Many fiduciary professionals manage risk by organizing long-term portfolios into two distinct layers using a core-satellite framework:
- The Core (80% to 95% of asset allocation): Broad, ultra-low-cost index funds tracking the S&P 500, a total market index, or a global basket. These capture overall market growth with minimal fees and near-zero manager risk.
- The Satellites (5% to 20% of asset allocation): Targeted tactical bets, such as thematic ETFs, individual stock picks, or sector-specific funds. These are strictly vehicles for potential alpha generation—outperforming the market—without compromising the foundational financial plan.
A thematic ETF belongs exclusively in the satellite layer. This institutional setup creates an asymmetric risk profile: if a specific theme like space or AI delivers on its promise, even a small position will noticeably boost your aggregate returns. If the sector experiences a structural failure, your core asset allocation keeps your retirement plan fully intact.

How Much Is Reasonable? Common Allocation Ranges
Before reviewing the standard benchmarks, a necessary compliance disclaimer: the ranges below represent macro-level investor education guidelines, not individualized fiduciary recommendations. Your ultimate allocation threshold depends entirely on your specific investment horizon, age, income stability, and your psychological drawdown tolerance.
A Worked Example: What a Bad Year Could Look Like
Percentages feel abstract until you see the dollars. Take a hypothetical $100,000 portfolio and imagine that the thematic part falls 50%, which is not unusual for concentrated funds during a bad stretch, while the rest of the portfolio stays flat. To contextualize this drawdown, consider how different allocation targets shift the overall risk profile of your capital:
| Thematic allocation | Amount in thematic ETFs | Value after a 50% drop | Total portfolio value | Total portfolio loss |
| 5% | $5,000 | $2,500 | $97,500 | 2.5% |
| 10% | $10,000 | $5,000 | $95,000 | 5.0% |
| 20% | $20,000 | $10,000 | $90,000 | 10.0% |
| 30% | $30,000 | $15,000 | $85,000 | 15.0% |
At 5%, a painful theme collapse costs you 2.5% of your total wealth. At 30%, the same collapse costs 15%, and many investors panic-sell at that point, which turns a temporary loss into a permanent one. According to data on investor behavior compiled in the Morningstar “Mind the Gap” Research, this 15% threshold is the exact psychological breaking point where retail participants capitulate and lock in catastrophic losses. The percentage you choose should be one you could hold through that scenario.
Three Tests to Find Your Number
1. The time-horizon test
As a baseline rule in asset management, money you’ll need within five years generally doesn’t belong in volatile funds. The shorter your horizon, the lower your thematic share should be, especially since regulatory bodies like the U.S. Securities and Exchange Commission (SEC) continuously warn that structural tech or space trends require extended market cycles to fully mature.
2. The sleep test
Every retail participant must perform an honest psychological stress test: imagine the thematic portion losing half its value. If that would make you sell, or lose sleep, your allocation is too high. In professional trading, the right number is the one you can hold through a drop without changing your plan, as over-allocating inevitably triggers emotional capitulation at the absolute bottom of a market cycle.
3. The overlap test
Institutional portfolio trackers consistently warn against structural asset redundancy: thematic funds often hold the same mega-cap stocks your core index funds already own. A large technology theme, for instance, may overlap heavily with cap-weighted benchmarks like the Nasdaq-100. The aerospace industry offers a perfect case study: after SpaceX (ticker: SPCX) officially joined the Nasdaq-100 Index via a fast-tracked inclusion framework, trillions of dollars in passive funds tracking that specific benchmark were forced to physically purchase its shares. Consequently, you may already have substantial structural exposure to SpaceX through your broad growth or large-cap tech core holdings, making an additional thematic fund redundant.
If you’re curious about SpaceX’s financial performance, take a closer look at whether SpaceX is actually profitable, including its revenue, margins and the costs behind its growth.
I had my own reality check with this exact overlap test recently. When SpaceX went public and fast-tracked its high-profile entry into the tech-heavy Nasdaq-100 index, I audited my portfolio and realized my core index funds automatically adjusted to hold a piece of it. This exercise highlighted a common retail pitfall: rushing into a specialized, high-fee space fund would have simply double-exposed my hard-earned capital to the exact same company, stacking unnecessary idiosyncratic risk onto a position I already owned.

Do Fees Really Matter for Thematic ETFs?
When evaluating specialized asset structures, structural costs matter far more than most retail participants expect. The U.S. Securities and Exchange Commission (SEC) continuously emphasizes that the compounding effect of high management fees (expense ratios) silently degrades long-term wealth, often eclipsing market returns. To visualize this drag, consider a simple, real-world comparison: suppose you invest a lump sum of $10,000 for a 20-year horizon, assuming the underlying equities deliver a steady 7% annualized return before costs:
| Annual fee | Return after fee | Value after 20 years |
| 0.03% (broad index ETF) | 6.97% | About $38,480 |
| 0.75% (typical thematic ETF) | 6.25% | About $33,620 |
Hypothetical example. Real returns vary every year.
This simple quantitative model reveals a sobering market reality: the higher fee costs you roughly $4,860 over 20 years in this example, and that is before accounting for any difference in net underlying performance. In structural terms, a thematic fund has a heavy mathematical hurdle to clear; it must outpace broad benchmarks just to break even after accounting for its internal premium. Therefore, it is essential to ask whether a specific sector narrative genuinely justifies that premium pricing.
Let’s be honest, calculated tables like this look incredibly dry on paper, and nobody likes obsessing over fractions of a percent. But seeing that a simple fee gap can quietly wipe out nearly five thousand dollars of my hard-earned money over twenty years completely changed how I filter new ideas for Orbit Investor. It proved to me that cost management is just as critical to portfolio survival as picking the right asset class.
How to Keep Your Allocation on Track
Without strict systemic oversight, an explosive thematic position can quietly drift and cannibalize a much larger share of your net worth than you originally budgeted. Suppose you hold an initial $5,000 in a specialized satellite within a $100,000 portfolio (5%). If that position doubles to $10,000 while the broad core remains unchanged, it now commands roughly 9.5% of your asset allocation. If it doubles again, the concentration risk becomes dangerously outsized, violating your foundational risk parameters.
To mitigate this asset drift, institutional guidelines from the U.S. Securities and Exchange Commission (SEC) suggest incorporating two disciplined portfolio habits:
- Rebalance on a Fixed Schedule: Conduct a systematic review once or twice a year to explicitly trim the over-allocated thematic position back to your baseline target, removing emotion from the execution.
- Implement Tactical Allocation Bands: Establish clear operational boundaries. For example, rebalance whenever the asset drifts beyond a set range, such as maintaining a strict target of 5% with mandatory rebalancing triggers enforced if the asset crosses above 7.5% or collapses below 3%.
From a tax perspective, investors must always account for potential fiscal friction: in a standard taxable brokerage account, liquidating winning positions will instantly trigger a capital gains tax liability. Rebalancing inside tax-advantaged accounts like an IRA or a 401(k) completely eliminates this tax drag under current IRS tax guidelines. Alternatively, you can rebalance organically by directing all new cash contributions exclusively toward your underweighted core funds, shifting the equilibrium back to target without triggering a forced sale.
Common Mistakes to Avoid
Successful portfolio management requires mitigating structural unforced errors. Retail investors consistently damage their long-term compounding by falling into these predictable tactical traps:
- Buying After a Sentiment Surge: Funds tend to attract the absolute most capital right after an aggressive performance run, which is precisely when subsequent forward returns become significantly harder to achieve.
- Accumulating Overlapping Ecosystems: Running multiple thematic bets simultaneously can create an accidental concentration loop. Highly correlated sectors like space, AI, robotics, and semiconductors frequently hold the exact same mega-cap technology constituents.
- Ignoring Fee Erosion: Failing to audit asset costs is a massive drag on wealth creation. As demonstrated in the previous case study, a 0.75% expense ratio compounding over decades will quietly cannibalize thousands of dollars from your final net worth.
- Judging a Fund Solely by its Marketing Name: Wall Street issuers use captivating labels to gather assets. A vehicle branded explicitly around “space” or “innovation” may hold surprisingly low exposure to the actual pure-play firms you expect, making it vital to read the actual underlying holdings list.
- Treating a Secular Megatrend as a Guaranteed Return: A rapidly growing industry does not automatically translate into a profitable investment structure. Asset prices actively discount forward expectations, meaning the growth narrative is likely already priced into the equity.
- Holding Leveraged Products for Long-Term Exposure: Utilizing leveraged ETFs within a multi-year satellite strategy is a dangerous misunderstanding of product mechanics. As the Financial Industry Regulatory Authority (FINRA) explicitly warns, these specialized vehicles reset daily and suffer from compounding volatility decay, making them mathematically unsuitable for long-term buy-and-hold strategies.
Before You Buy: A Quick Checklist
Deploying capital into speculative satellites requires absolute alignment with your broader financial framework. Before opening any new thematic position, ensure you can affirmatively answer this strategic checklist:
- Is my emergency fund in place, and is my core portfolio already built?
- What is the fund’s expense ratio, and what do its top 10 holdings look like?
- How much of my total portfolio would all thematic funds represent together?
- Could I hold this position through a 50% drop?
- Do I plan to rebalance, and on what schedule?
- Is this money I won’t need for at least five years?
Frequently Asked Questions
How much of my portfolio should be in thematic ETFs?
Consensus among fiduciary advisors is to restrict your combined thematic and speculative exposure to a strict 5% to 10% range, anchoring the remaining 90%+ in diversified, low-cost broad market index funds. Your optimal baseline allocation depends entirely on your specific financial goals, multi-year investment horizon, and structural drawdown tolerance.
Are thematic ETFs good for beginners?
Broad market diversification should always precede sector speculation. While thematic products can technically occupy a small satellite position in a beginner’s portfolio, market history proves that novice investors are far better served by aggressively building a core foundation of low-cost index funds first before taking on concentrated asset risks.
Can I put thematic ETFs in a Roth IRA?
Generally yes, assuming your brokerage platform supports the specific ticker. From an asset location perspective, a Roth IRA is an efficient vehicle for high-growth satellite strategies because qualified structural withdrawals are completely tax-free. However, investors must weigh the asymmetric downside: capital losses generated inside an IRA cannot be utilized to offset ordinary taxable capital gains on your tax return.
How many thematic ETFs should I own?
In portfolio architecture, a leaner setup is structurally superior. Owning a sprawling list of multiple themes inevitably introduces heavy asset overlap and triggers unmanaged portfolio drift, pushing your aggregate speculative exposure far higher than your risk parameters intended.
Do thematic ETFs beat the S&P 500?
Select specialized funds have delivered historical outperformance during specific market cycles, but long-term alpha is never guaranteed. Furthermore, rigorous investor behavior research demonstrates that retail participants consistently earn significantly less than the funds’ posted returns due to chronic performance chasing and poor structural timing.
Should I sell a thematic ETF that has gone up a lot?
Rather than letting an individual winner grow without boundary, disciplined investors systematically rebalance back to their target strategic allocation. Before executing any trade in a standard taxable brokerage account, you must actively calculate the embedded capital gains tax friction, as fiscal drag can heavily diminish your net realized returns.
What percentage is too much?
Pushing your exposure above a 20% threshold of your total portfolio is universally considered excessive, as a single niche narrative will begin to systematically dominate your aggregate net worth. Whether a lower allocation is already too high depends entirely on your personal liquidity needs and psychological capacity to endure sector-specific volatility.
The Bottom Line
Thematic ETFs are a great way to capture structural trends, but they work best as a small satellite around a diversified core. For most portfolios, a combined 5% to 10% threshold is a sensible allocation ceiling, and having a fixed plan for systematic rebalancing matters just as much as the percentage itself. Pick an amount you can hold through a severe drawdown, keep your structural fees in check, and never let a compelling narrative dictate your risk parameters.
At the end of the day, building long-term wealth isn’t about collecting the coolest-sounding themes or guessing which industry will dominate the next decade. Personally, I love tracking these futuristic aerospace trends for Orbit Investor, but I keep my speculative capital small. Ensuring my broad core portfolio remains fully intact gives me the peace of mind to enjoy the upside without losing sleep over a market downturn.
Disclaimer
This article is for informational and educational purposes only and is not personalized investment, financial, tax or legal advice. Nothing here is a recommendation or solicitation to buy or sell any security. All investing involves risk, including the possible loss of your entire investment, and past performance does not guarantee future results. Figures are approximate, are current as of October 10, 2026, and may change. Before making any investment decision, I strongly urge you to do your own research and consider speaking with a licensed financial professional.
Sources and Further Reading
- Investor.gov – Investor Bulletin: Index Funds | Investor.gov
- Investor.gov – Investor Bulletin: Alternative Mutual Funds | Investor.gov
- Morningstar.com – Mind the Gap
- Morningstar.com – The Big Shortfall: Understanding the gap in thematic funds
- Morningstar.com – Global Thematic Fund Landscape: Trends, Performance and Investor Insights
- Investor.gov – Investor Bulletin: Investment Scams and Fraud Prevention
- Nasdaq – Space Exploration Technologies Corporation to Join the Nasdaq-100 Index® Beginning July 7
- SEC.gov – Investor Bulletin: How Fees and Expenses Affect Your Investment Portfolio
- Investor.gov – Investor Bulletin: Understanding Investment Fees and Expenses
- IRS.gov – Retirement Plans: Frequently Asked Questions About Individual Retirement Arrangements (IRAs)
- FINRA.org – Financial Industry Regulatory Authority: Investor Education and Protection
- Morningstar – The Dark Side of Thematic Funds
- Investor.gov (SEC) – Introduction to Investing
Written by L.Gomez · Last updated: October 23, 2026